If you aren’t familiar, the Houston Astros cheating scandal is lighting the baseball world aflame. They have been accused of stealing pitch calls and relaying them via trash can bang during the 2017 season. This is the same season that they won the world series. More recently, they have been accused of taping buzzers to their chests to relay the same information. At this point, no one is really denying that the cheating happened. With this in mind, I wanted to try to evaluate how much this cheating contributed to them winning during 2017.
Code if you want to replicate this analysis: https://github.com/PlayingNumbers/Astros_Analysis
If you would prefer to watch a video on this: https://www.youtube.com/watch?v=aaAZXeuPIXk
The Data
Recently, I came across www.signstealingscandal.com. On this website, Tony Adams painstakingly watched every home game from the 2017 season and tracked the number of trash can bangs that he heard. This is a great data-set, and I wanted to use it for an analysis.
For each home game, Tony tracks the number of bangs and the score. I also appended the hits data and the by inning data to make this analysis more robust. I wrote a simple scraper to get the game box scores from baseball reference.
For this analysis, I was not aware that the bangs by at bat were available, so I used the aggregates by game. I will be doing a part 2 of this analysis after I analyze the by player / by inning data.
Correlation analysis
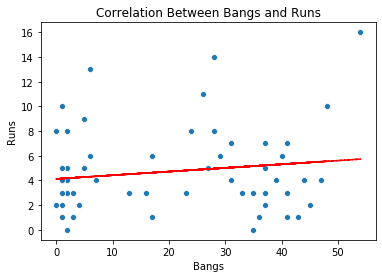
First, I wanted to do a high level analysis to see if there was a relationship between bangs and runs or hits. For both of these variables, the correlation was extremely low (~.14). This was not exactly a promising start to the research.

As you can see in the scatterplot, there is virtually no relationship between the number of bangs and the number of runs.
Linear Regression Analysis
I still wanted to see if bangs was a significant predictor of runs even though there was a negligible correlation. A linear regression is the most practical tool answer this question.
Not surprisingly, our regression results mirrored the correlation analysis. Bangs were not a significant predictor of runs, and bangs explained less than 3% of the variance in runs (R-Squared = .022).

Logistic Regression Analysis
In theory, it is possible that sign stealing could help a team win without contributing directly to hits or runs. I ran a logistic regression to test the relationship between bangs and wins.
Again, bangs were not a significant predictor of wins.

A New Hypothesis
I was stumped. This had to go deeper than what my preliminary models were telling me. I decided to look into the number of bangs in wins and in losses. As it turns out, the Astros banged on average 22.2 times in losses and 16.8 times in wins.
This lead me to a new hypothesis: Maybe the Astros primarily resorted to cheating when they were behind.
Testing the “cheating when behind” theory
I tested this by looking at how many bangs there were when the Astros were behind early. The graph below shows a huge spike in the number of bangs when the Astros are losing in the early innings.

The Astros still banged on cans in games where they were winning, but this number is greatly reduced from their losing games.
Next, I looked at how the Astros performed when they were coming from behind. If they were cheating in these circumstances, we would expect that they would out perform the average team. Sure enough, the Astros win percentage when coming from behind was outrageously high.

It could be that they were just a generationally good team. I wanted to test how well they performed against other aggregates to determine if this was the case.
I looked at how well the team performed when they were ahead as well. You see the exact opposite trend in this case.

You can see that the Astros won far less games than would be expected when they were leading throughout the game.
I find this to be quite a large anomaly. We see that they outperform the average team when coming from behind and banging more, but under perform the average team when ahead and banging less.
Final Thoughts
On the surface level, it looks like cheating didn’t greatly impact the team’s ability to win. However, we can clearly see very strange trends when peeling back the layers. This article is the tip of the iceberg when it comes to analyzing the cheating scandal. I would hope that this perspective brought an additional layer to your understanding of the mechanisms at play.
In part 2 of this analysis, I will go through the by inning data provided at www.signstealingscandal.com. I hope to be able to quantify how much each bang contributed to hits, getting on base, and runs.

Like!! Really appreciate you sharing this blog post.Really thank you! Keep writing.